Monitoring Stack
Prometheus and Grafana giving real-time visibility into server metrics across the homelab.
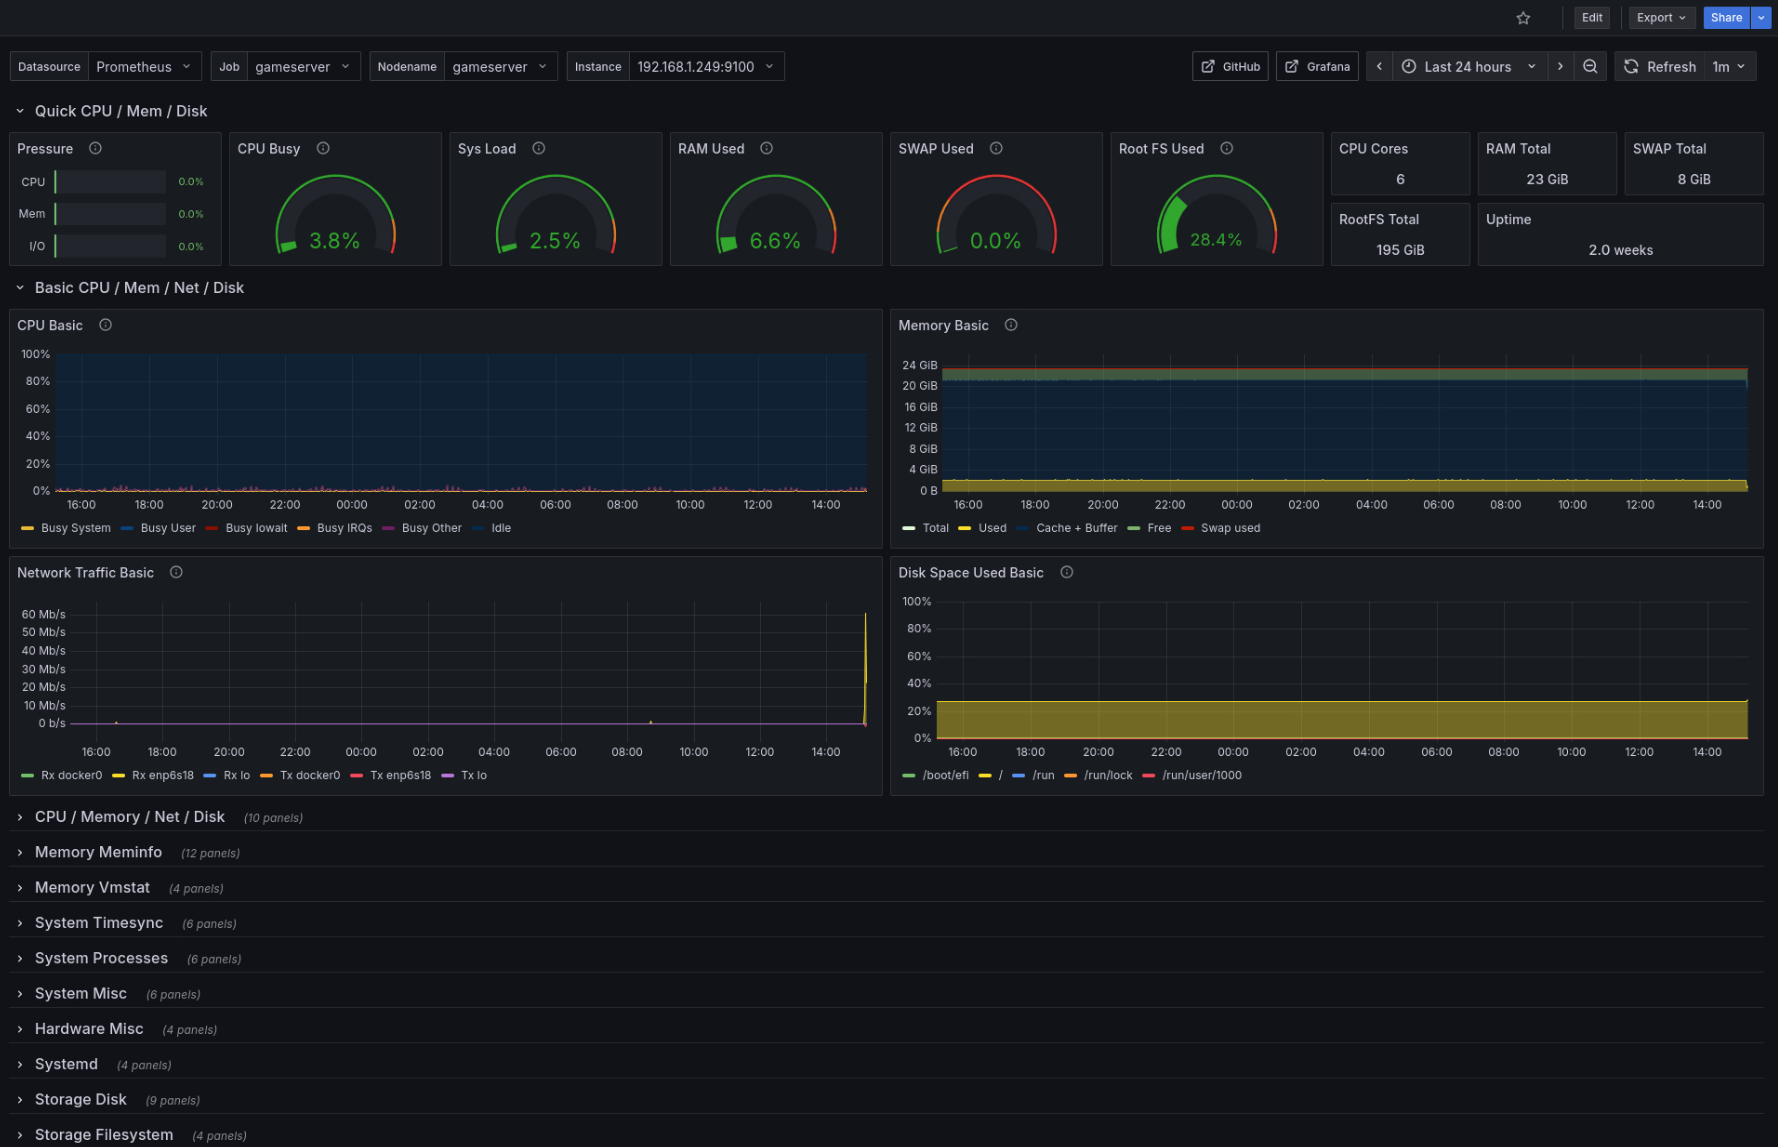
Node Exporter Full dashboard — gameserver
The Idea
The monitoring stack came from wanting to make use of a screen for my homelab — I saw other labs which had server usage metrics so I went ahead with grafana. The goal is eventually to have full visibility across every server in the homelab. Right now it's only on the game server, with plans to roll it out to the rest of the VMs over time.
How It Works
The stack is built around three components working together:
- Node Exporter runs on the gameserver VM. It exposes a metrics endpoint that describes the current state of the system — CPU usage, memory, disk, network and more — in a format Prometheus understands.
- Prometheus runs on the displayserver and scrapes the Node Exporter endpoint on a regular interval, storing the metrics as time series data. It's configured to target the gameserver by IP and port.
- Grafana connects to Prometheus as a datasource and visualises the collected metrics in dashboards. The main dashboard in use is the community Node Exporter Full dashboard which provides a comprehensive view out of the box.
The Dashboard
The Node Exporter Full dashboard is split into several sections. At the top a quick summary row shows CPU pressure, system load, RAM usage, swap, root filesystem usage and uptime at a glance. Below that are detailed time series graphs covering:
- CPU usage broken down by idle, user, system and IO wait
- Memory usage showing total, used, cache and swap over time
- Network traffic in and out across all interfaces
- Disk space usage across all mounted filesystems
Further sections drill into memory statistics, system processes, hardware, systemd services and storage — giving a complete picture of what the server is doing at any point in time. The dashboard is displayed on the monitor sitting on top of the rack, connected to the Pi 5.
Where It Runs
Prometheus and Grafana both run via Docker on displayserver — a dedicated Ubuntu Server VM on Proxmox. Keeping monitoring on its own VM means it stays up and accessible even if the gameserver VM is restarted or under load.
What's Next
The plan is to deploy Node Exporter across all VMs and containers in the homelab and add them as scrape targets in Prometheus. That would give a unified view of the entire infrastructure in a single Grafana dashboard — CPU and memory across jellyfinCT, jellyseerrCT, the gameserver and websiteCT all in one place.